How We Took a Health Brand from 6.2% to 18.18% CVR
How We Took a Health Brand from 6.2% to 18.18% CVR

3-Year Engagement
How We Took a Health Brand from 6.2% to 18.18% CVR
twifmedia.online
The Growth Engine
The Challenge: No Online Presence for a Health & Wellness Brand
Bounce Back to Life Consult came to me with a simple but fundamental problem: there was no established online presence.
The business needed more than a website. It needed a system that could attract the right people, educate them, qualify their needs, convert them, measure the results, and bring interested prospects back.
Increase supplement sales while keeping customer acquisition costs under control and making the marketing investment measurable.

My Approach: Building a Growth System, Not Just Running Ads
I approached the project as a growth-system problem, rather than simply an advertising problem.
Instead of immediately putting more money into ads, I focused on building the infrastructure that would allow the business to convert and measure traffic effectively. The growth engine was built around four interconnected experiments.
Identified where visitors were dropping off and improved the journey from initial interest to action — page structure, messaging, offer presentation, calls to action, and conversion points.
Introduced a diagnostic-style quiz that understood the prospect, created relevance, and recommended a next step — turning a generic supplement offer into a personalised journey.
Incorporated educational content so prospects understood the problem and the relevance of the solution before being asked to purchase.
Used Meta advertising to drive targeted traffic — audience segmentation, campaign structure, creative testing, retargeting, and budget allocation on an average of ~$20/week.
The objective was not simply "get the click." It was: get the right person, give them enough context to take the next step, and move them toward becoming a customer.
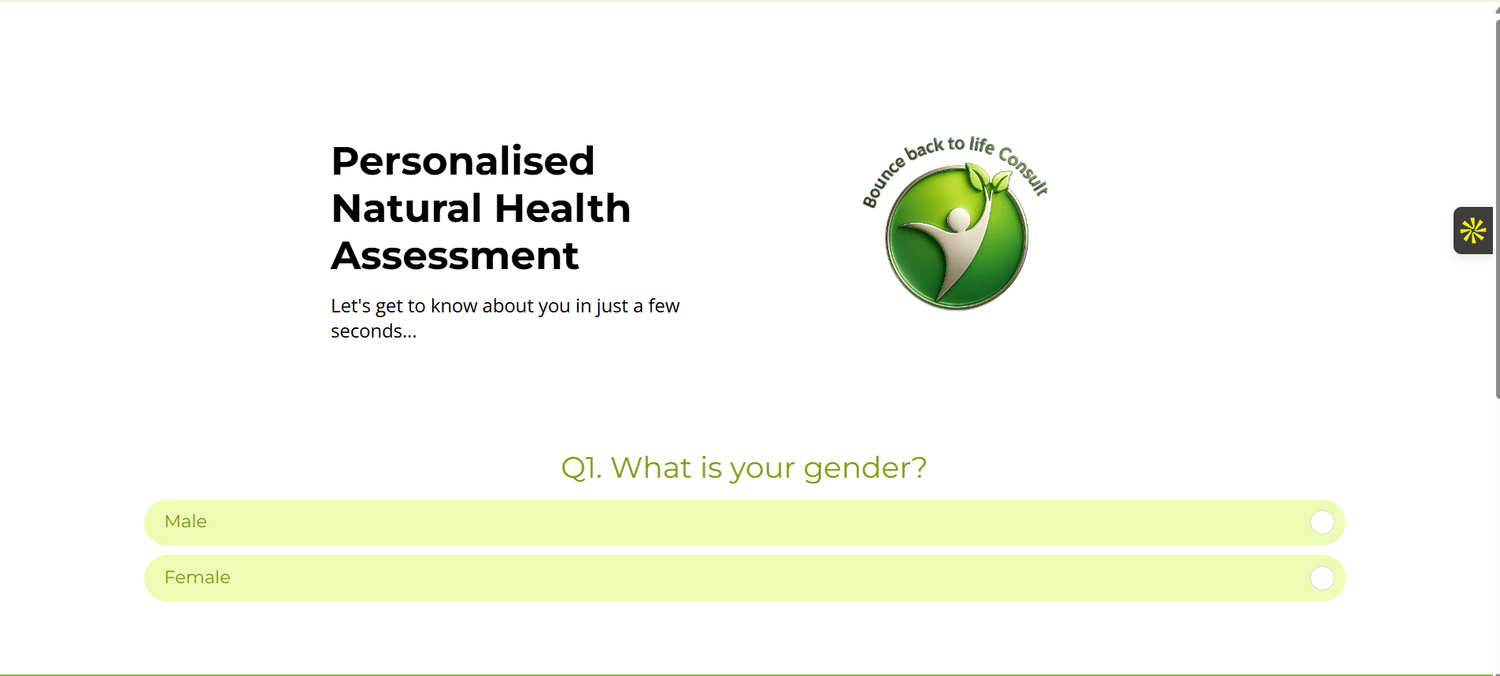
The Funnel: From Meta Ads to Diagnostic Quiz to Conversion
Each stage was designed to work together rather than as separate, disconnected activities.
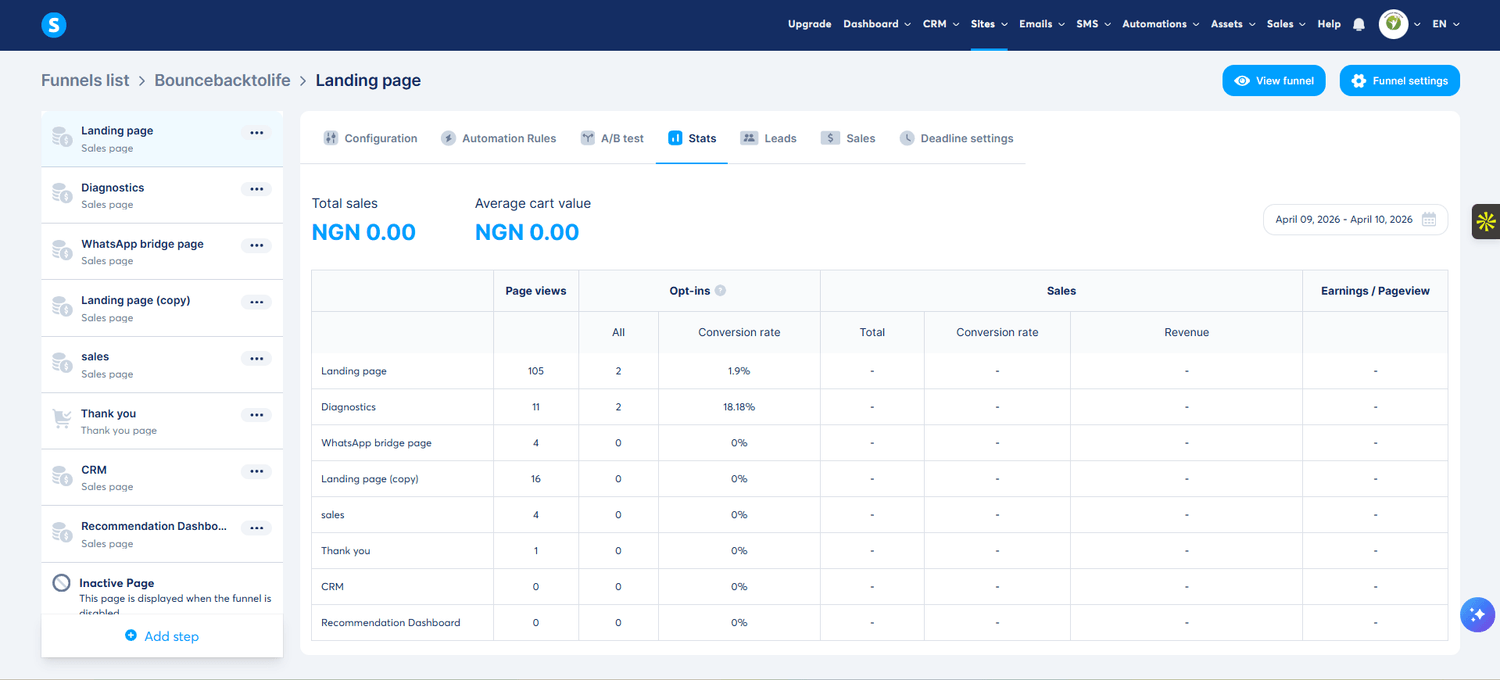
The Breakthrough: 6.2% to 18.18% Conversion Rate
The most significant improvement came from the conversion layer, not from more traffic.
More traffic wasn't necessarily the answer. The existing traffic could produce substantially more value once the customer journey was redesigned and optimised.
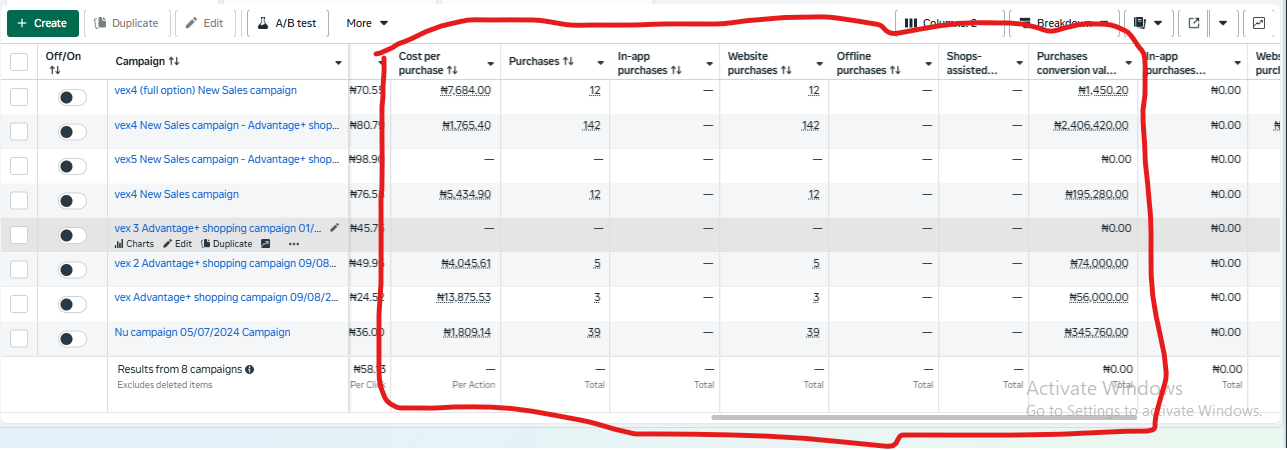
Results: 8x ROAS, 47 Qualified Leads, 14 New Customers
Measurable growth across revenue, leads, and customer acquisition — from a modest budget.
The campaign generated approximately $2,400+ in revenue from $300 in advertising spend — the system generated qualified prospects rather than simply optimising for clicks or impressions, and converted qualified demand into actual customers.
What I Actually Learned About Traffic vs. Conversion
The most important lesson from this project wasn't the 8× ROAS.
It was understanding the relationship between traffic, conversion, and customer acquisition cost.
A common response to poor campaign performance is "we need more traffic." But if the funnel is leaking, more traffic simply means more people entering the same broken journey.
This project reinforced my approach of looking at the entire system — traffic, funnel, conversion, retargeting, customer — before deciding where to invest additional resources.
Don't scale traffic until you've built a system capable of converting it.
Why This CRO & Growth Marketing Project Matters
This project demonstrates my ability to work across multiple layers of growth rather than operating as an ads-only marketer.
- Strategy: Identified the growth problem and designed the acquisition approach.
- Funnel: Built the journey that moved prospects toward conversion.
- CRO: Improved the conversion experience from 6.2% to 18.18%.
- Paid Media: Managed Meta campaigns and optimisation.
- Content: Incorporated content-led demand generation.
- Retargeting: Created additional opportunities to convert interested prospects.
- Analytics: Measured the journey and used performance data to guide optimisation.
Even with a relatively small advertising budget, better customer-journey design and conversion efficiency can create significantly more value from the traffic a business is already paying to acquire.
Built by a practitioner, not a theorist.
I help businesses build predictable revenue systems by combining Growth Strategy, Funnel Architecture, Conversion Rate Optimisation, Performance Marketing, Content Strategy, and Analytics.
This engagement with Bounce Back to Life Consult ran for three years — spanning conversion optimisation, a diagnostic quiz funnel, content-led demand generation, and paid campaign management on a lean budget.
Field Glossary
- ROAS (Return on Ad Spend)
- Revenue generated for every dollar spent on advertising — an 8× ROAS means $8 in revenue for every $1 spent.
- Conversion Rate Optimisation (CRO)
- The practice of reducing friction in the customer journey to increase the percentage of visitors who complete a desired action.
- Diagnostic Quiz Funnel
- A qualification step that personalises the offer by understanding the prospect's specific needs before presenting a recommendation.
- Retargeting
- Re-engaging prospects who showed interest but did not convert on their first visit, bringing them back into the funnel.
- Qualified Lead
- A prospect who has demonstrated genuine intent or fit, rather than simply clicking an ad or visiting a page.
Bounce Back to Life Consult Case Study · $300 → $2,400+ Revenue · 193% CVR Lift
Uchenna Charles Imoh · @uchenna_imoh · twifmedia.online
Ready to grow?
Your product is good enough.
Your funnel just needs to catch up.
Every month without a working funnel is a month of ad spend that disappears. Let's build the system that fixes that — permanently.

© 2025 TWIF Media. All rights reserved. Built with 3+ years of real campaign data.